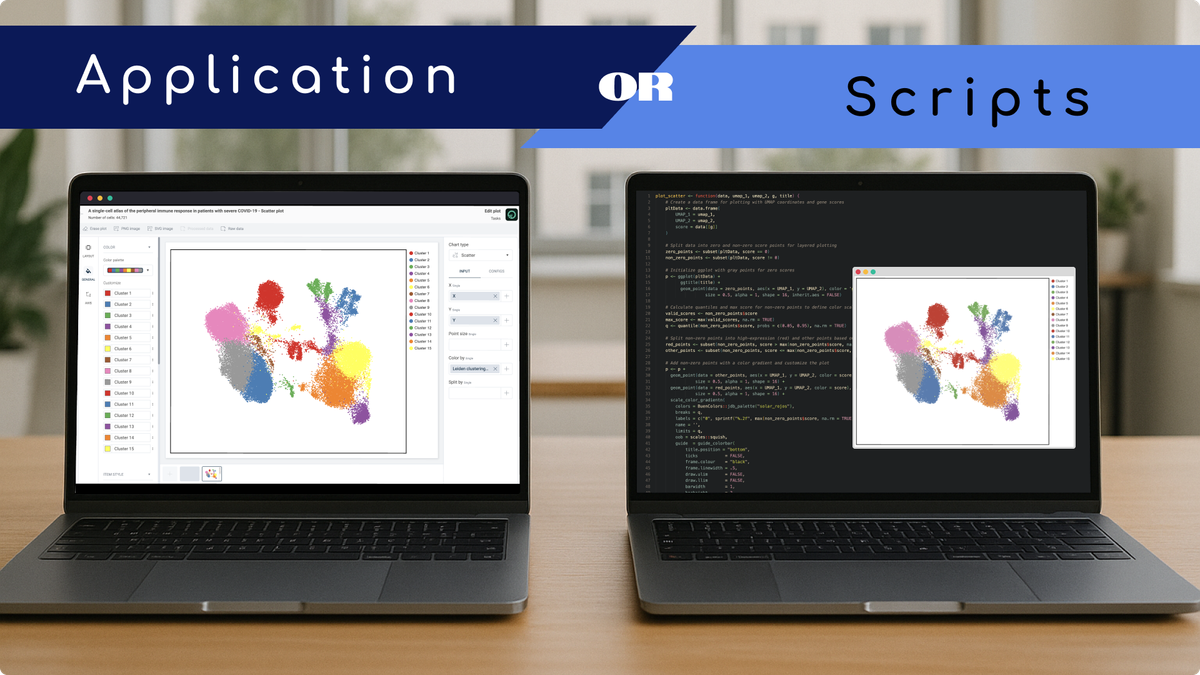
When to use Application vs Scripts in scRNA-seq analysis
Single-cell RNA sequencing (scRNA-seq) has become a cornerstone of modern biology, offering unprecedented resolution into cellular diversity, states, and functions. With this power comes complexity: analyzing scRNA-seq data involves multiple steps, from quality control and normalization to clustering, visualization, and differential expression analysis. Each step can be approached through two distinct paths: using graphical applications or writing code.
Graphical software like OmnibusX offers an integrated environment where researchers can explore, analyze, and visualize their data through a user-friendly interface. In contrast, scripting with R or Python provides complete flexibility, enabling users to customize every step of the pipeline.
This blog post is a practical guide to help you decide when to use an application and when to use code in your scRNA-seq data analysis journey. Whether you're a biologist seeking intuitive exploration or a bioinformatician writing complex workflows, we’ll walk through the strengths and trade-offs of each approach and show how they can complement each other effectively.
Use case scenarios for applications
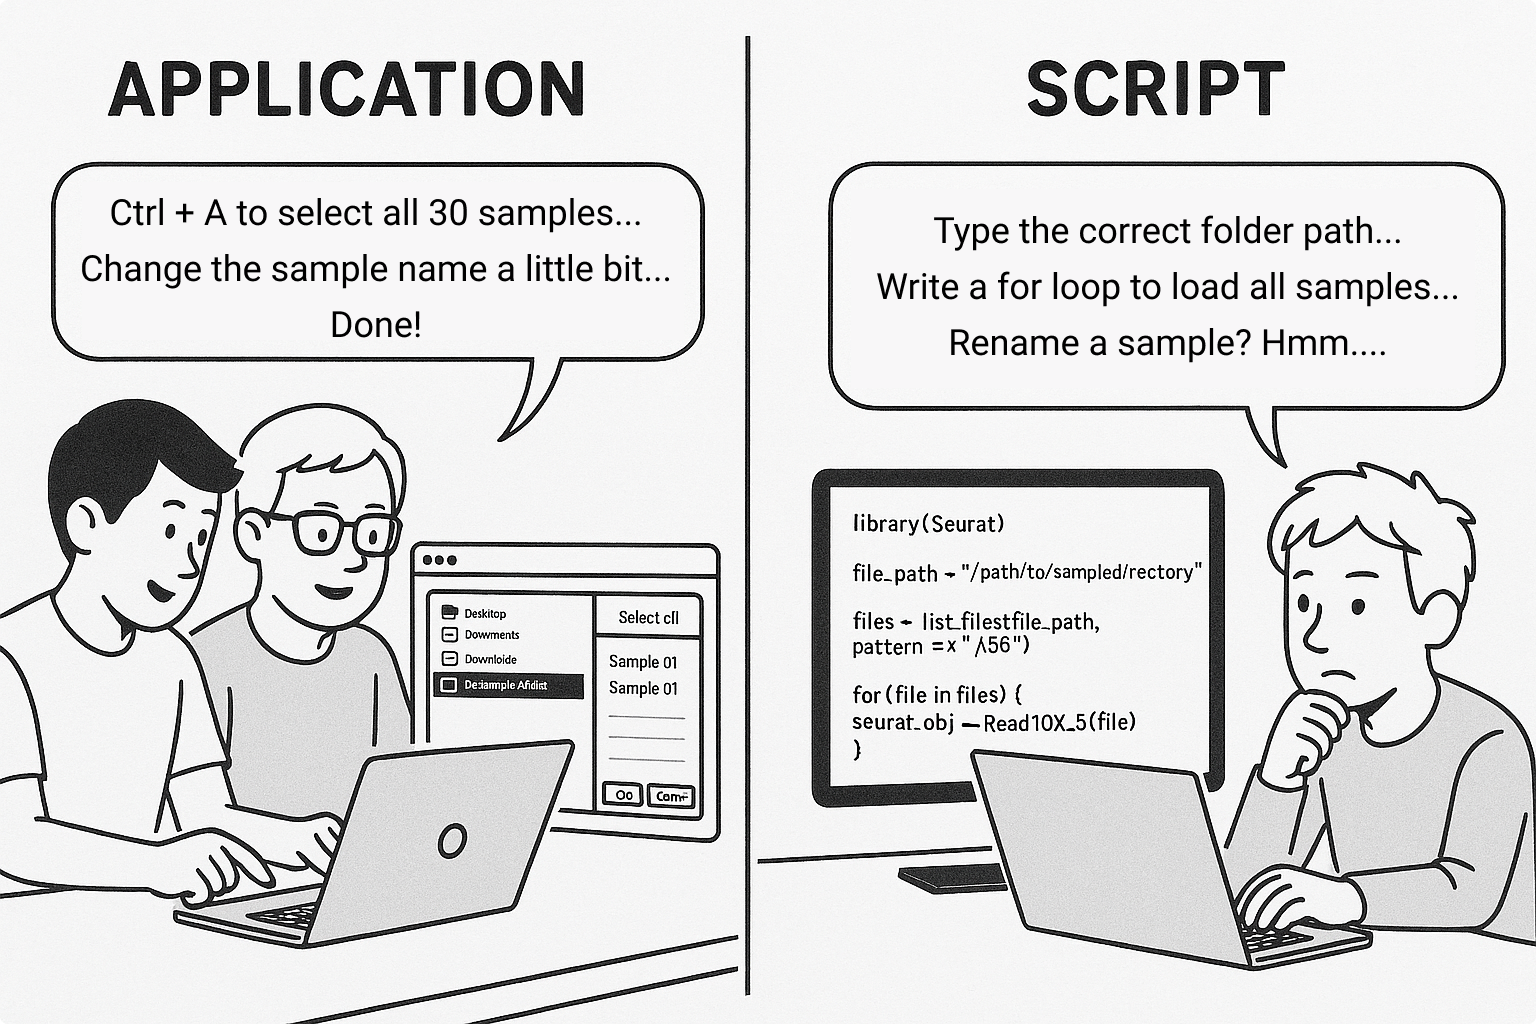
1. When performing routine or standardized analyses
Using an application can make things easier for routine steps that you repeat across datasets, like loading the data, normalizing, running PCA, and clustering. A button often replaces a long series of commands that are already tested and consistent. You still have the flexibility to adjust parameters, but without needing to rewrite code each time. Small changes like updating file paths or output names can introduce errors even with a solid script. An application helps reduce these manual steps and keeps the workflow more stable.
2. When collaborating across teams
In collaborative settings, team members often have diverse technical backgrounds. OmnibusX supports centralized data storage, group workspaces, and role-based access control, making it easy for bioinformaticians, biologists, and pathologists to work together on the same dataset. Analysts can upload pre-processed data, while others can explore results and annotate findings — all in the same environment.
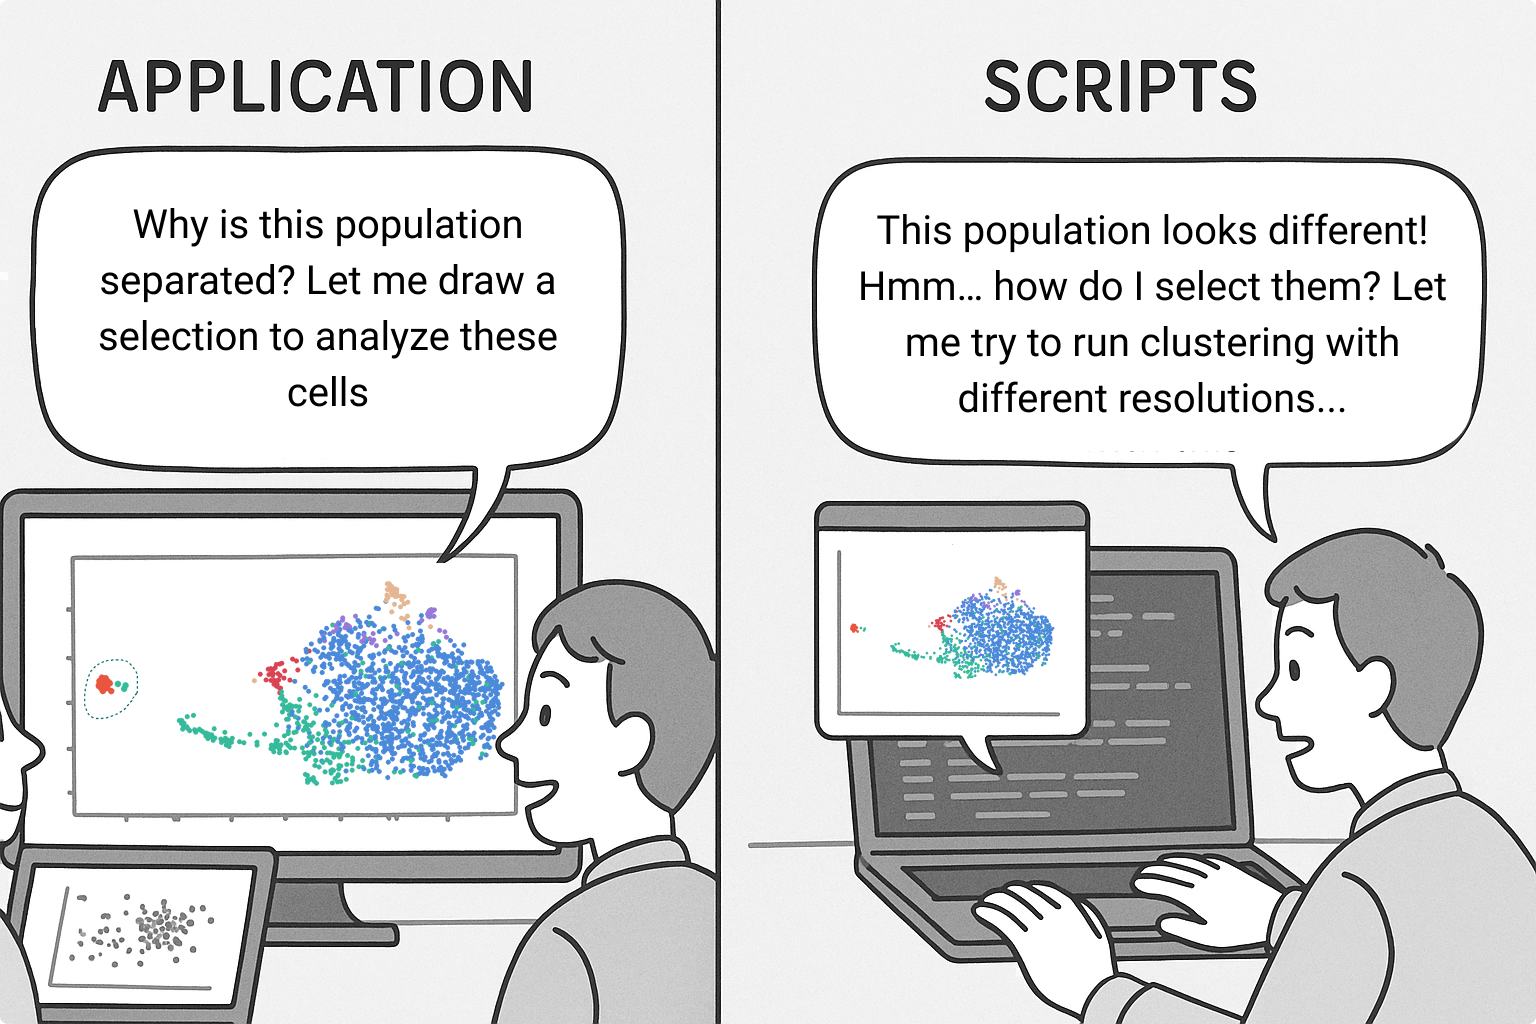
3. When you need to interact intensively with the data
Running a script to perform a specific task, like drawing a scatter plot colored by gene expression, is straightforward. But data exploration often requires a more complex set of actions to interpret what you’re seeing. For example, you might notice a small cluster that stands apart and wonder: Is it a low-quality population? A group of dividing cells? Or something biologically distinct?
Answering these questions typically involves multiple follow-up checks — looking at the number of detected genes, checking cell cycle markers, reviewing sample composition, or identifying cluster-specific markers. This kind of back-and-forth reasoning is much easier in an interactive application. Instead of stopping to read documentation, look up functions, edit code, and fix execution errors, you can click through actions more fluidly, making exploration faster and letting you stay focused on the science.
4. When preparing figures and reports
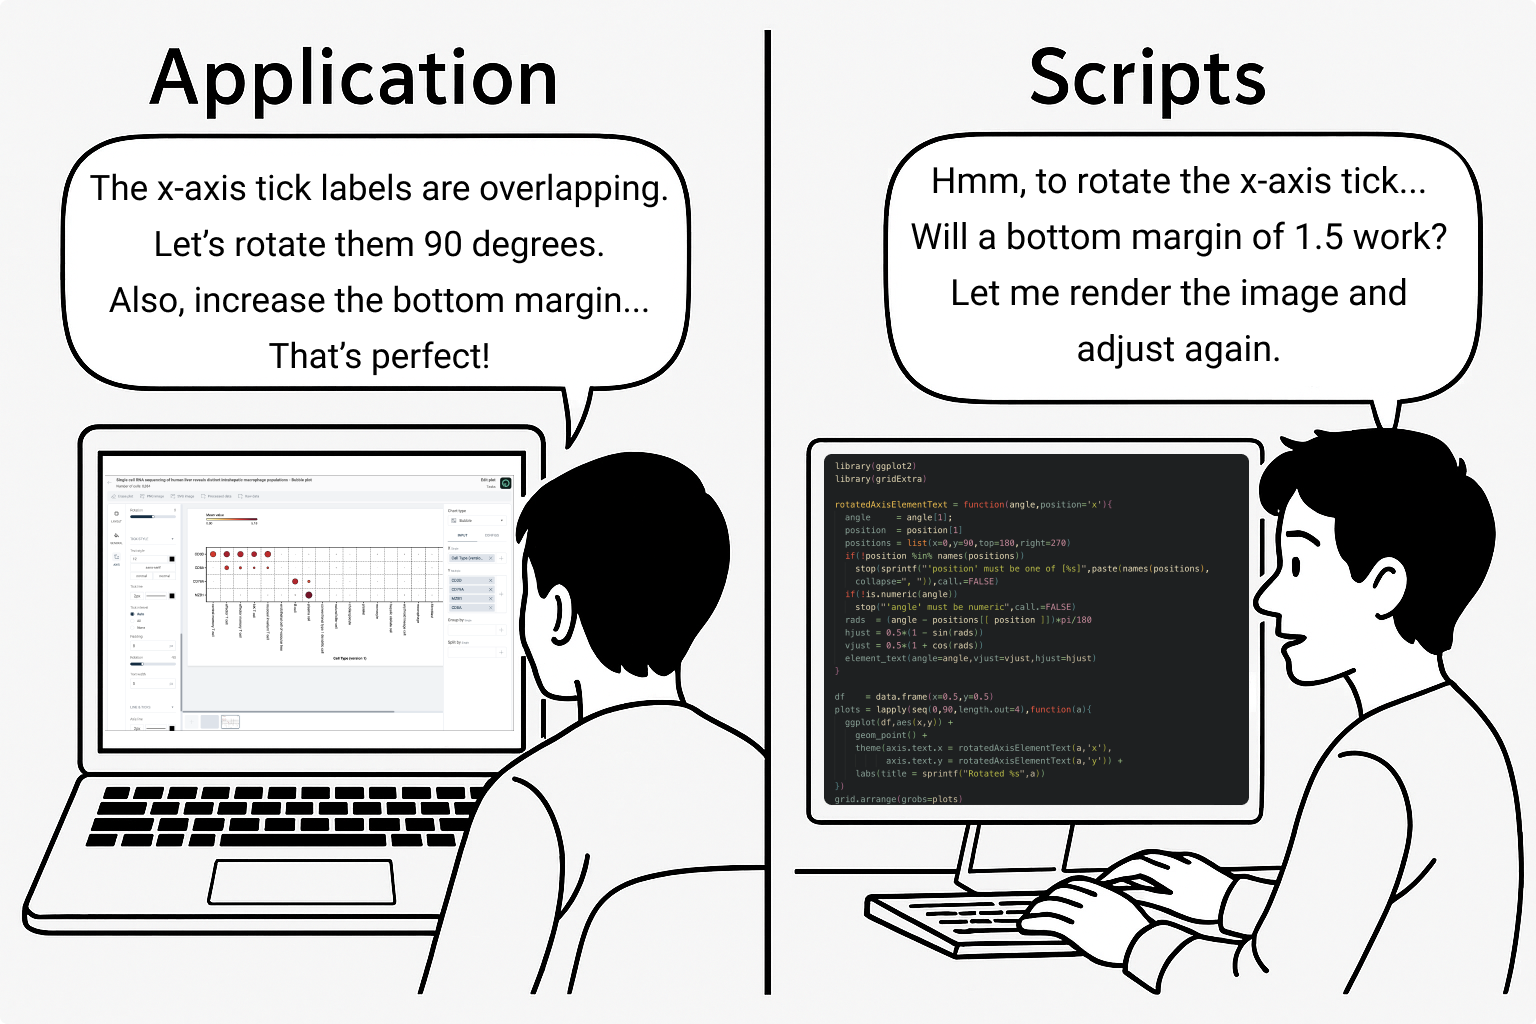
Creating publication-ready figures is often one of the most time-consuming parts of data analysis, especially when using code. Even small changes, like adjusting the color palette, reordering groups, or rotating text, can mean digging through documentation and rewriting chunks of code.
OmnibusX makes this process faster and more flexible. With built-in tools for customizing plots, you can adjust colors, font sizes, axis labels, element order, and more — all with a few clicks, drag things around, or just type the number in the input box. This kind of visual fine-tuning is much easier in an interactive environment, helping you focus on the message you want your figure to deliver, not the code behind it.
When to use code (R/Python)
1. When developing or testing new algorithms
If you're researching new clustering methods, normalization strategies, or trajectory inference models, you'll likely need to code your own functions or modify existing packages. Custom algorithm development isn't something most applications are built for — code gives you full flexibility and control.
2. When integrating into complex, multi-stage pipelines
Many research labs have established pipelines for data preprocessing, quality control, and model training that span multiple tools and data types. Integrating scRNA-seq analysis into a broader workflow (e.g., combining with proteomics or genomics) often requires scripting to ensure compatibility, automation, and reproducibility across stages.
3. When working with large-scale or unconventional datasets
For massive datasets, custom code may be better suited for optimizing memory usage, parallel processing, or distributed computing. Similarly, unconventional datasets (e.g., very sparse, multi-batch, or non-standard formats) might need bespoke handling before they can be analyzed or visualized.
4. When applying advanced or experimental analysis methods
Some methods — like Bayesian modeling, trajectory inference with custom priors, or deep learning-based clustering — may not yet be supported in graphical tools. Coding allows you to explore these advanced techniques using the latest packages and research prototypes.
5. When you need full control over statistical testing and interpretation
From choosing statistical models to applying custom thresholds or corrections, scripting allows detailed configuration and inspection at every step. This level of transparency is critical in sensitive analyses where model assumptions must be explicitly controlled.
In short, coding is invaluable when your analysis requires flexibility, novelty, or deep customization. It complements application-based workflows, especially in research contexts where the standard pipeline is just the beginning.
Next, we’ll discuss how OmnibusX bridges the gap between these two approaches, enabling hybrid workflows that bring together the best of both worlds.
How OmnibusX bridges the gap
In practice, many research projects benefit from combining graphical applications with custom scripts. OmnibusX is designed with this in mind, providing a flexible framework that allows users to move between interface-based analysis and external coding environments with ease.
1. Export results for downstream analysis in R/Python
OmnibusX allows users to export their datasets into formats compatible with external analysis tools like Scanpy. After completing key steps such as QC, normalization, clustering, and marker detection within OmnibusX, users can export the entire dataset as a Scanpy h5ad object, which includes:
- Raw and normalized gene expression matrices
- Cell-level metadata (e.g., clusters, cell types, sample conditions)
- Dimensionality reduction results (UMAP, t-SNE, PCA)
- Other relevant annotations supported by Scanpy
For more focused use cases, partial exports are also supported:
- Metadata only: Export as a .tsv file for quick use in custom scripts
- Embeddings only: Export UMAP, t-SNE, or PCA coordinates as .tsv
- Plot data: Export the underlying data used to generate any visualizations
This flexibility enables researchers to use OmnibusX for structured analysis and visualization, while seamlessly integrating with code-based workflows for advanced modeling, publication figures, or further downstream analysis.
2. Import external results into OmnibusX for visualization and collaboration
Researchers can also import results generated elsewhere, such as:
- Custom cluster labels
- Dimensionality reduction coordinates (e.g., UMAP, t-SNE)
- Custom marker genes or pathway scores
OmnibusX automatically maps these results to the corresponding dataset, allowing biologists and collaborators to explore findings visually, even if the analysis was performed externally.
3. Modular design encourages hybrid workflows
By separating core analysis modules (e.g., preprocessing, annotation, visualization), OmnibusX allows users to plug in only the steps they need. A bioinformatician might process data outside the platform, then hand off the annotated dataset to colleagues for exploration and figure generation within OmnibusX, without breaking the flow.
4. Supporting multi-omics integration with a consistent structure
For teams working on multi-modal projects (e.g., scRNA-seq + scATAC-seq or spatial transcriptomics), OmnibusX standardizes the structure across data types. This simplifies integration tasks, and results from code-based pipelines can still be imported for visualization or comparison in the same environment.
In this way, OmnibusX doesn’t force a one-size-fits-all workflow — instead, it acts as a collaborative layer that connects the reproducibility and accessibility of applications with the flexibility and depth of code-based analysis.
Conclusion
There’s no one-size-fits-all answer when it comes to analyzing scRNA-seq data. The right approach depends on your project goals, technical background, and how much flexibility you need.
Graphical applications like OmnibusX make it easier to explore datasets, share findings, and produce high-quality results, especially when speed, consistency, and collaboration are priorities. On the other hand, scripting in R or Python remains essential when your analysis requires novel methods, deeper statistical control, or integration into broader pipelines.
Rather than choosing one over the other, many researchers benefit most by combining both: using OmnibusX to quickly process and visualize, and switching to code for tasks that demand customization or scale. The ability to move between these modes — and to share results across teams — is becoming increasingly important in today’s data-driven biology.
As single-cell technologies continue to evolve toward multi-omics, having tools that balance accessibility and flexibility is key. OmnibusX is built to support that balance, helping researchers turn data into insight, whether through a user-friendly interface or a code-powered pipeline.