Gemcitabine efficacy across tumor types: A pan-cancer study of 50 cancer cell lines
Gemcitabine (2′,2′-difluorodeoxycytidine) is a nucleoside analog widely used in the treatment of various solid tumors, including pancreatic, non-small cell lung, breast, and bladder cancers. Although its primary mechanism involves inhibition of DNA synthesis leading to S-phase arrest and apoptosis, variability in drug response across different cancer types remains a major clinical and scientific challenge. Here, we present a comprehensive pan-cancer analysis of Gemcitabine's effect across 50 human cancer cell lines derived from diverse tissue origins and histological types. This study aims to characterize differential sensitivity patterns and investigate potential mechanisms underlying unexpected or attenuated responses.
S-phase arrest
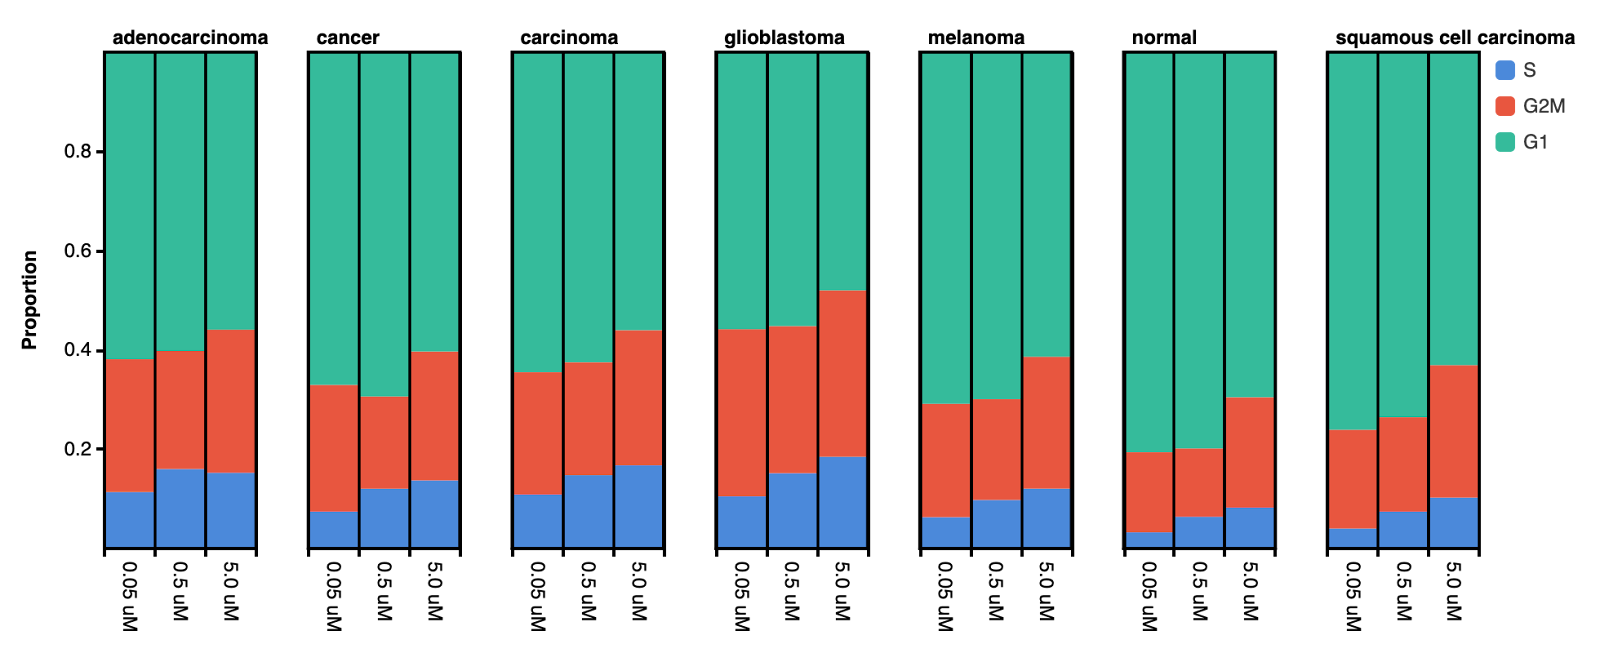
The examination of cell cycle phase composition in correlation with Gemcitabine concentration revealed a concentration-dependent increase in S-phase accumulation. However, the magnitude of this effect varied across different cancer types (Figure 1). Notably, squamous cell carcinoma and normal cells exhibited the greatest increase in S-phase fraction, particularly at 5.0 μM, with increases of 155% and 151%, respectively (Table 1). In contrast, carcinoma and adenocarcinoma demonstrated more modest increases, with adenocarcinoma showing an atypical pattern in which the higher concentration of Gemcitabine (5.0 μM) induced a lower S-phase increase (34%) compared to 0.5 μM (41%).
Table 1. Magnitude of change in S-phase fraction with increasing Gemcitabine concentrations across different cancer types.
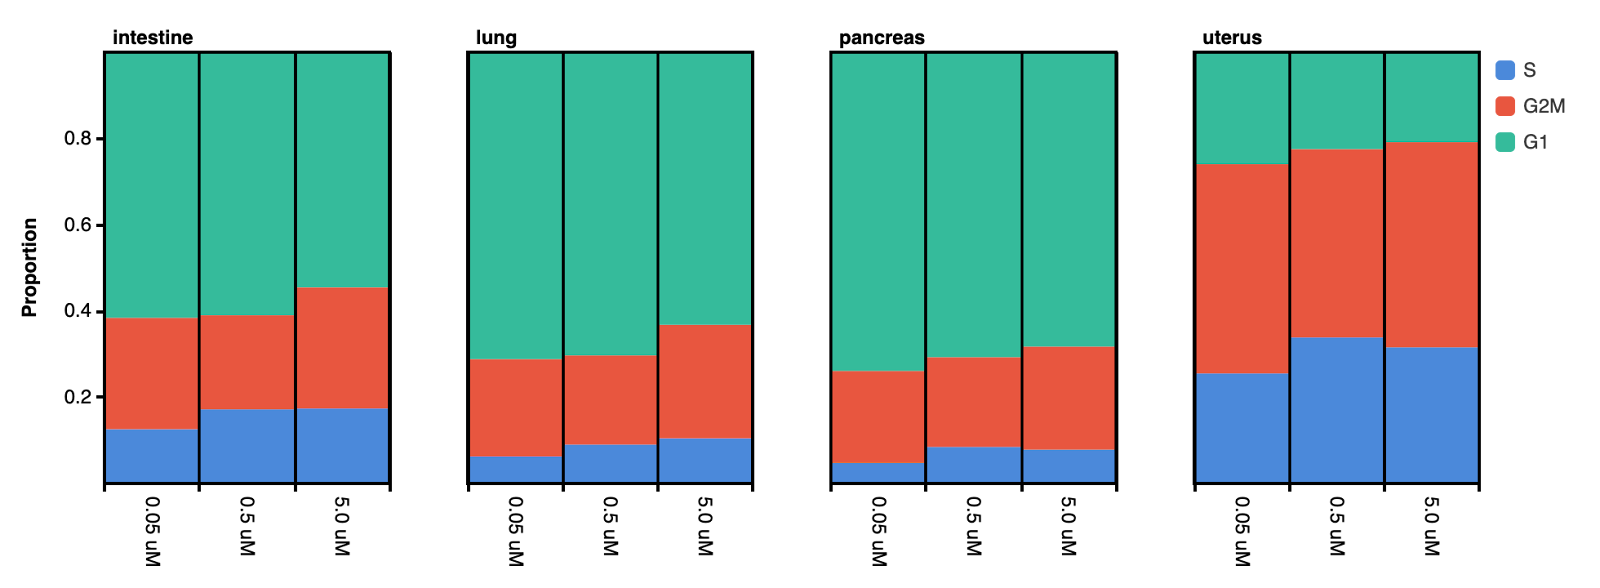
Further analysis of the cell cycle phase composition within the adenocarcinoma population revealed a consistent pattern across different tissue origins, including lung, pancreas, intestine, and uterus. In these models, increasing Gemcitabine concentration resulted in little or no increase in S-phase accumulation, with some cases showing a slight reduction at higher doses (Figure 2). This suggests that Gemcitabine’s effect on cell cycle arrest is influenced by cancer type–specific characteristics rather than tissue origin.
Cell apoptosis
To further investigate the effects of Gemcitabine-induced S-phase arrest, we performed differential gene expression analysis on S-phase cell populations treated with 0.05 μM and 0.5 μM Gemcitabine. Enrichment analysis of the resulting differentially expressed genes (DEGs) revealed that treatment with the higher concentration (0.5 μM) led to downregulation of genes associated with negative regulation of apoptosis, cell division, and DNA damage response process. Conversely, upregulated genes were enriched for biological processes indicative of apoptosis activation, including positive regulation of apoptotic signaling and activation of the DNA damage response mediated by p53 (Figure 3). These results suggest that Gemcitabine promotes apoptotic processes through p53-dependent pathways.

Resistance mechanism
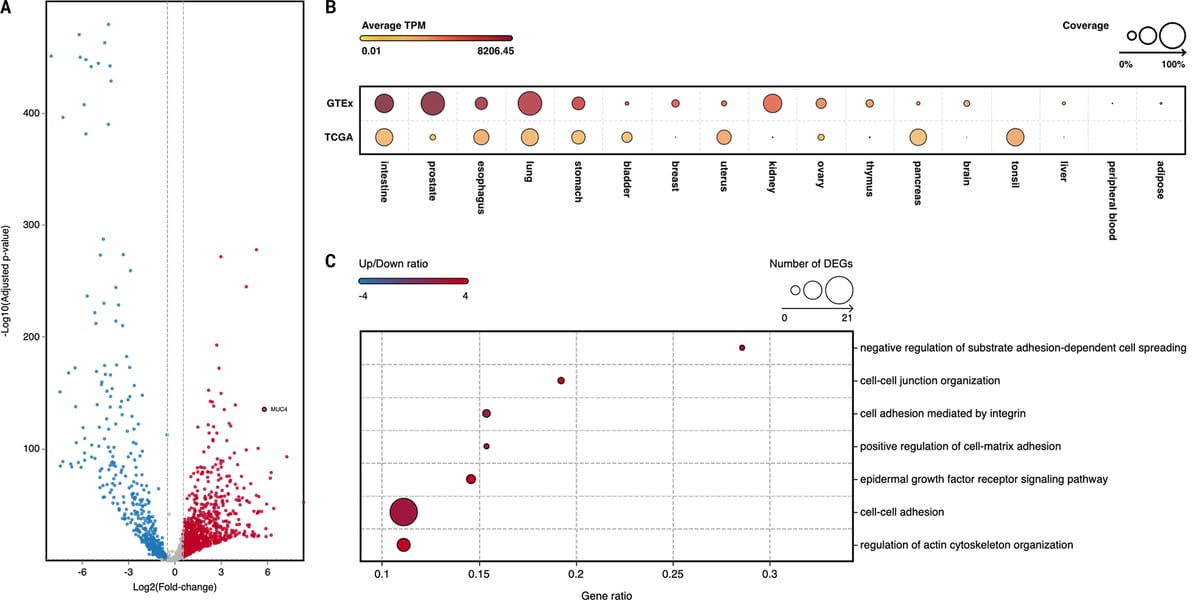
To further investigate the mechanism underlying the low efficacy of Gemcitabine in the adenocarcinoma population, we performed differential gene expression analysis between pancreatic adenocarcinoma and normal pancreas, the latter of which showed a strong Gemcitabine-induced S-phase arrest. This analysis revealed significant upregulation of MUC4 (Figure 4A), a gene previously shown to play a key role in Gemcitabine resistance in pancreatic adenocarcinoma (Satish et al., 2022). MUC4 has been demonstrated to downregulate key nucleoside transporters (hENT1, hCNT1, and hCNT3) that are essential for Gemcitabine uptake. Consistent with these findings, bulk RNA-seq data confirmed that MUC4 is expressed exclusively in pancreatic cancer (TCGA samples) and absent in normal pancreas tissue (GTEx samples) (Figure 4B).
Enrichment analysis of DEGs further highlighted cell adhesion-related pathways, including cell-cell junction organization, integrin-mediated adhesion, and cell-matrix adhesion (Figure 4C). These alterations may create physical barriers limiting Gemcitabine penetration and uptake in pancreatic adenocarcinoma.
Conclusion
This pan-cancer study demonstrates significant variability in Gemcitabine-induced S-phase arrest across tumor types. Squamous cell carcinoma and normal cells exhibited strong S-phase accumulation, while adenocarcinoma showed limited or reduced S-phase response at higher concentrations. Our findings suggest that these differences are driven by cancer–type–specific mechanisms rather than tissue origin.
In pancreatic adenocarcinoma, MUC4 emerged as a key contributor to Gemcitabine resistance by suppressing nucleoside transporter expression and potentially reducing drug uptake. Enrichment of cell adhesion pathways further suggests that altered cell architecture may hinder drug penetration. These insights highlight the need for biomarker-driven strategies and targeted approaches to improve Gemcitabine efficacy in resistant tumor types.
Data source
Data were downloaded from the published study "Tahoe-100M: A Giga-Scale Single-Cell Perturbation Atlas for Context-Dependent Gene Function and Cellular Modeling." OmnibusX curated the datasets, and interactive analysis is available through the OmnibusX free-access database: https://omnibusx.ai/studies/doi.org.10.1101.2025.02.20.639398. MUC4 expression profiles in GTEx and TCGA samples were accessed at https://omnibusx.com/genes/MUC4.