Define novel cell subtype using single-cell datasets
Uncovering hidden treasures in cellular diversity
The advent of single-cell technologies has revolutionized our understanding of biological complexity, providing a lens through which we can discern the fine details of cellular heterogeneity. This transformative approach enables researchers to characterize cell types and discover new subtypes that have remained elusive with previous methodologies. However, defining new cell subtypes often relies on the independent efforts of individual researchers. In this blog, we'll show you how to leverage publicly available single-cell datasets to hypothesize and verify novel cell subtypes, providing stronger evidence before committing to laboratory experiments, ultimately saving time and resources.
To illustrate this process, we'll use the NKG2C+ subtype of natural killer (NK) cells as an example. The process can be summarized into three key steps:
- Retrieve the list of related studies
- Characterize the subpopulation from the initial dataset
- Verify the validity of the subpopulation across other datasets
Step 1: Retrieve the list of related studies
To begin defining novel subtypes of natural killer (NK) cells, our first task is to find research studies that include significant populations of NK cells. This can be done easily using the OmnibusX’s search studies tool. The most straightforward method is to select all NK cell subtypes from the cell types categories and initiate a search. This utilizes predefined categories from author annotations to filter the studies.


However, it's common for researchers to group NK cells with T cells under the label "T/NK cells". To account for this, you can use free text search options to find studies based on these broader annotations.


Furthermore, NK cells are sometimes mislabeled as T cells or general lymphocytes in studies. To pinpoint NK cell populations more accurately, we employ gene expression profiles, which are strong indicators of specific cell types. By identifying a unique marker for NK cells, such as KLRF1, we can then search for studies where this marker is expressed.

If you're not sure which marker to use, OmnibusX offers the cell types search tool where you can discover potential markers for NK cells across hundreds of studies. After selecting "natural killer cell", a table displaying potential markers will appear.


To ensure the uniqueness of these markers, you can also check their expression patterns across different cell types at this genes search tool. Inputting the marker will show which cell types express these genes across 140 studies, presented in a cell ontology tree structure. The more simple the structure, the more unique the marker is.

By using the marker KLRF1 as an example, we conduct a thorough search to retrieve all studies that might contain NK cell populations, regardless of how they were annotated by the study's authors. However, we will still need to dive deeper into each study to explore the possible subtype patterns of NK cells that may be hidden within the data.
Step 2: Characterize the subpopulation from the initial dataset
To explore potential new subtypes of NK cells, we begin by analyzing data from specific studies. In this example, we focus on the study "Distinct microbial and immune niches of the human colon", which is accessible for download here. We'll use the OmnibusX desktop application to explore the study, but you can use any app of your choice for convenience. Here, we import the scanpy object deposited by the author into the OmnibusX app.
Refining cell type annotations
This particular study has already categorized a group of cells as NK cells. However, due to common issues with mislabeling—where NK cells are often confused with T cells—it's crucial to verify and refine these annotations.
We use specific markers to accurately identify the NK cell population:
- CD3D: is exclusively found on T cells.
- FCER1G: is broadly expressed across NK cells, myeloid lineage, and B cells.
- KLRF1: is a marker for both NK and some subpopulations of T cells.
You can explore the expression patterns of these genes across cell types here. To pick out NK cells, first query for the genes CD3D and FCER1G:
- Red population (CD3D only): Represents T cells.
- Blue population (FCER1G): Represents a group of NK cells, myeloid cells, and B cells.
- Yellow population: Indicates doublets as they express multiple lineage markers.

Through the initial sorting, we notice some populations are potentially mislabeled (e.g., labeled as cycling gdT cells but lacking CD3D expression and showing FCER1G). Such errors are common as NK and certain T cells (like NKT and gamma-delta T cells) share many markers (TRDC, NKG7, FCGR3A, FGFBP2, …)

To accurately refine the NK cell identification, we look for clusters expressing FCER1G and further refine these groups by sub-clustering and analyzing for the presence of KLRF1. This step helps us isolate pure NK cell populations effectively.

If you're using the OmnibusX app, there's a quicker way to identify possible NK cells using our advanced cell type prediction algorithm, which provides predicted labels with a simple click.

Sub-clustering and Identifying Subtypes
After isolating the NK cells, our next step involves a more detailed exploration to identify distinct subtypes within this population. Given that, in the global scope, subtypes of NK cells might be mixed together into one cluster, preventing us from revealing the pattern, we employ sub-clustering to separate these cells further. Since the author does not provide batch-corrected results, we also need to perform batch correction between donors and use the result for t-SNE and re-clustering the NK cell population.


The resulting t-SNE scatter plot reveals two distinct cell populations. Initially, we hypothesized these might represent the well-recognized NK cell subtypes: CD56dim and CD56bright. To confirm this, we proceed with specific markers:


Analysis of the expression patterns for these markers shows that the vast majority of the identified NK cells are CD56bright, with only a small fraction being CD56dim. This distinction in the scatter plot strongly indicates that we are observing separate subpopulations within the CD56bright NK cells, each potentially representing a unique subtype.


Marker selection
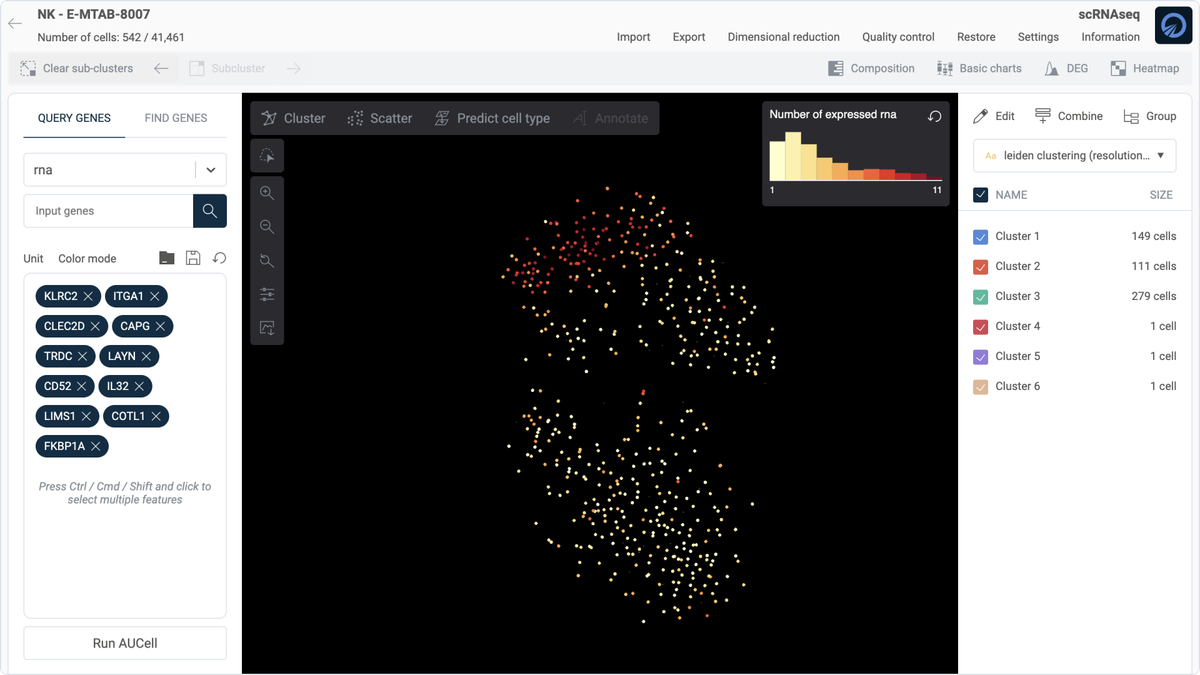
Once we've identified distinct subpopulations within the NK cells, our focus shifts to pinpointing specific markers that characterize these groups. For the purposes of this guide, we concentrate on one particular population—Cluster 2—to investigate its unique genetic signature compared to other cells. To identify markers that distinctly define Cluster 2, we use the "Find gene" function within OmnibusX, which performs a t-test to determine the most distinct markers for this cluster in comparison with the remaining population.


Each gene identified through this process is then evaluated for its specificity to Cluster 2. We look for genes with clear and distinguishing expression patterns that set this group apart from others.

Additionally, markers can be selected based on their uniqueness across various cell types by referencing the comprehensive single-cell database on OmnibusX. This helps in excluding genes that are commonly expressed across multiple cell types or those that are not specific to the cellular functions of interest.

This initial selection of markers may include genes influenced by external factors such as environmental conditions, age, or the technologies used in sample preparation. Therefore, this gene set serves as a preliminary foundation, which we will refine and validate in subsequent analyses across additional studies. This iterative process helps in solidifying the biological relevance and robustness of the markers associated with Cluster 2.

Step 3: Verify the validity of the subpopulation across other datasets
Once we have identified potential new subtypes of NK cells, the next crucial step is to confirm the consistency of these findings across different datasets. This validation process determines whether the subtypes we've observed are genuinely reproducible in other experimental setups or if they are unique to the initial study.
To proceed, we revisit the list of studies compiled in Step 1. We then apply the same analysis methods from Step 2 to another dataset, for example, "A single-cell atlas of the peripheral immune response in patients with severe COVID-19," which is available for download here. In this subsequent study, we successfully identified a similar CD56bright NK cell subpopulation, mirroring our initial findings.

By comparing the marker lists from both the initial and subsequent studies, we refine our markers to those consistently identified across both datasets. This step yields a more concise list of markers, reinforcing the validity of these NK cell subtypes based on independent experimental evidence. With confirmed markers, we can further bolster our hypothesis by extending the analysis to additional studies. This iterative verification helps build a stronger case for the existence of the new subtype.
Additionally, we can enhance our understanding of these subtypes by consulting the scientific literature. For instance, markers like KLRC2 (NKG2C) have been suggested to confer adaptive features to certain NK cell populations (Miguel et al., 2023). Such insights are invaluable for hypothesizing the functional roles of these subtypes. Once we gather sufficient evidence supporting the stability and relevance of these NK cell subtypes across different datasets and corroborate this with literature, the stage is set for deeper exploration. You can then use these insights to design experiments that specifically target these subtypes, ultimately advancing our understanding of their biological roles and potential implications in health and disease.
Conclusion
In our exploration of defining novel cell subtypes using single-cell data, we have demonstrated a systematic approach to identify, characterize, and validate new subtypes using publicly available single-cell datasets. This journey underscores the irreplaceable role of human insight, despite the emergence of numerous AI models aimed at automating the labeling process.
At OmnibusX, we are committed to simplifying and streamlining this complex process to facilitate and accelerate the discovery of new cellular insights. We appreciate your interest in our journey through the fascinating world of single-cell data analysis. Your engagement and curiosity are what drive the scientific community forward, and we look forward to sharing more discoveries with you in the future. Thank you for reading, and remember that your efforts are crucial in this uncharted territory of scientific exploration.