Uncovering Alzheimer’s Chromatin Accessibility: scATAC-seq Data Re-analysis with OmnibusX
Introduction
Unlocking the molecular mechanisms of Alzheimer's disease involves exploring both genetic and epigenetic factors that contribute to cellular dysfunction. Single-cell Assay for Transposase-Accessible Chromatin using sequencing (scATAC-seq) is a powerful technique that provides insights into chromatin accessibility at the single-cell level, shedding light on gene regulation and epigenetic diversity. In this blog post, we leverage the OmnibusX platform to re-analyze publicly available scATAC-seq data and reveal key chromatin accessibility patterns associated with Alzheimer's disease. Through this re-analysis, we aim to uncover novel insights into the regulatory landscape of this neurodegenerative disorder.
Background
Alzheimer’s disease (AD) is a complex neurodegenerative disorder linked to significant transcriptional and epigenetic changes. While many studies have explored gene expression differences between AD patients and healthy controls, fewer have investigated the regulatory mechanisms behind these changes. The GSE214979 dataset, featuring single-nucleus RNA sequencing (snRNA-seq) and single-nucleus ATAC sequencing (snATAC-seq) from 105,332 nuclei, uncovers cis-regulatory elements (CREs) associated with AD-specific transcriptional changes.
In this re-analysis, we use the OmnibusX platform to process and interpret the GSE214979 scATAC-seq dataset. This analysis highlights chromatin accessibility patterns related to Alzheimer’s, showcasing the application’s capabilities for exploring epigenetic landscapes in neurodegenerative diseases.
Analysis Workflow
Step 1: Data Submission and Automated Cell Type Annotation
The analysis begins with submitting the GSE214979_filtered_feature_bc_matrix.h5 file to the OmnibusX platform (Figure 1). This file, a direct output from the 10X Genomics Cell Ranger pipeline, is provided by the original study authors. Using the OmnibusX automated pipeline, the data is processed seamlessly.
At this stage, OmnibusX Cell Type Prediction assigns cell type labels to the dataset automatically (Figure 2). This step is essential for subsequent analysis, enabling the exploration of chromatin accessibility patterns within distinct cell populations and enhancing the understanding of Alzheimer’s disease epigenetics.

Figure 1: Submitting the GSE214979_filtered_feature_bc_matrix.h5 to the OmnibusX platform.

Figure 2: The data is processed using the OmnibusX pipeline. The cell type annotation is assigned automatically using the OmnibusX Cell Type Prediction.
Step 2: Exploring Transcriptomic and Chromatin Landscapes
In this step, the OmnibusX platform is used to explore distinct transcriptomic and chromatin landscapes associated with specific cell types. First, the normalized gene expression of GAD2, a well-known marker for GABAergic neurons, is visualized on a UMAP plot (Figure 3). This is followed by visualizing the normalized fragment count of GAD2 on a separate UMAP plot (Figure 4). Both visualizations confirm that GAD2 expression is specific to GABAergic neurons in this dataset.

Figure 3: The normalized gene expression value of GAD2

Figure 4: The normalized fragment counts of GAD2
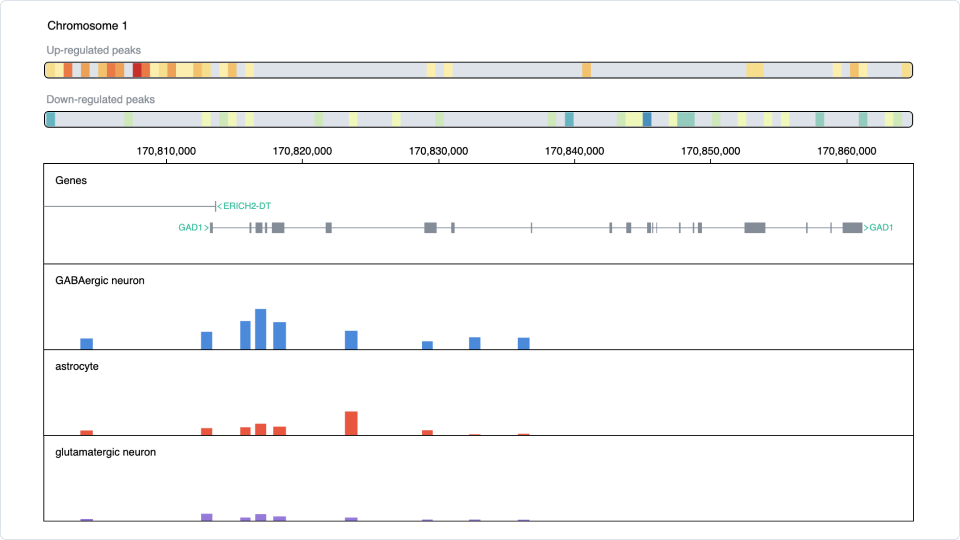
Next, the find marker function identifies additional markers for GABAergic neurons using the fragment count expression matrix (Figure 5). Among the results, the gene GAD1 is selected. The chromatin accessibility of GAD1 is then explored using the built-in genome browser, revealing that this gene is specific to GABAergic neurons as well (Figure 6).

Figure 5: The “Find marker” function identifies the markers of the GABAergic neuron

Figure 6: Visualize the chromatin accessibility of the gene GAD1 across cell types using the built-in genome browser.
Step 3: Identifying Differential Chromatin Accessibility Patterns with DESeq2
In this step, DESeq2 is leveraged within the OmnibusX platform to identify differential chromatin accessibility patterns between Alzheimer's disease (AD) patients and controls through pseudo-bulk analysis. The goal is to uncover genes showing differential chromatin accessibility between these two groups.
First, two comparison groups are defined: Alzheimer's disease ("AD") for group 1 and control patients ("Ctrl") for group 2. Since DESeq2 was originally designed for bulk RNA-seq data, the platform aggregates the single-cell ATAC-seq (scATAC-seq) data into pseudo-bulk samples. To do this, the donor ID metadata is selected to ensure accurate aggregation, while sex is specified as a confounding factor to account for biological variability (Figure 7).
With the configuration set, the DESeq2 test is run through the platform's intuitive user interface, eliminating the need for manual coding. The result is a list of genes with differential chromatin accessibility between AD and control groups, which aligns with known findings. For instance, the transcription factor HES4 emerges as differentially accessible (Figure 8), consistent with prior research by Chen et al., which highlighted HES4 as a key factor in Alzheimer's pathology.
The platform also provides clear visualizations of chromatin accessibility patterns, showcasing up- and down-regulated regions between AD patients and controls (Figure 9), aiding in the interpretation of these findings.

Figure 7: Configure and perform DESeq2 test using the OmnibusX platform

Figure 8: The DESeq2 analysis result shows the differentially accessible chromatin between AD patients and controls.

Figure 9: The visualization of chromatin accessibility patterns, showcasing up- and down-regulated regions between AD patients and controls.
Conclusion
This re-analysis of the GSE214979 dataset using the OmnibusX platform showcases the efficiency and power of scATAC-seq data processing, visualization, and interpretation. From automated cell type annotation to identifying differential chromatin accessibility patterns in Alzheimer’s disease, OmnibusX simplifies complex workflows, making it a valuable tool for researchers studying epigenetic landscapes.
With features like pseudo-bulk analysis using DESeq2 and the built-in genome browser, researchers gain deeper insights into cell-type-specific regulatory mechanisms and their implications in diseases such as Alzheimer’s. By providing an intuitive interface, OmnibusX streamlines these analyses, eliminating the need for extensive coding and manual data processing.
Ready to accelerate your single-cell research? Download OmnibusX and unlock new insights into your scATAC-seq and multiomics data at https://omnibusx.com/apps.