A Story Told by Data
Once upon a time, a brave team was given a very dangerous mission: to bring down two giant castles that had stood for a long, long time.
The team was made up of many small squads — T cells, B cells, Myeloid cells, and more — each with a special role. They gathered quietly around the castles, preparing to attack from every direction.
No one knew exactly what would happen next. But they all understood one thing: This mission could change everything.
Suddenly, a signal lit up at the command center.
“This is B cell squad. Reporting in.
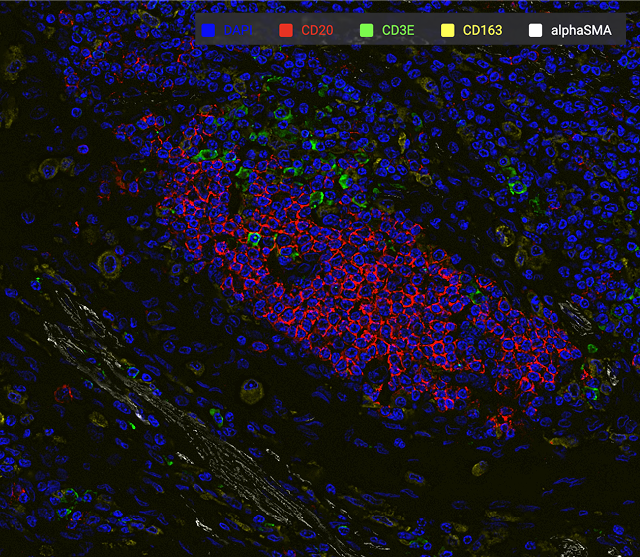
Plasma cell unit has successfully infiltrated deep inside Target B.”
Cheers rippled through the radio lines — but there was no time to celebrate.
“T cell unit here.
Regulatory T cells have surrounded Target B, locking it down.
Effector T cells have taken control of every position inside the fortress.”
“What about Target A?”
“We’re trying to connect with them through the Protein line, but the signal... It’s too weak. Almost gone.”
“Switch to the RNA line!”
BEEP.
Connection established.
“Commander, we can not penetrate into Target A.”
“... because the enemy is too strong?”
A pause crackled over the channel.
“...actually, it’s the opposite. Their density is lower...”
“Why???"
"Call in the Dendritic cell scouts. We need full intelligence on this fortress, every signal, every pathway, every hidden defense.”
The mission pressed on! No one dared to slow down.
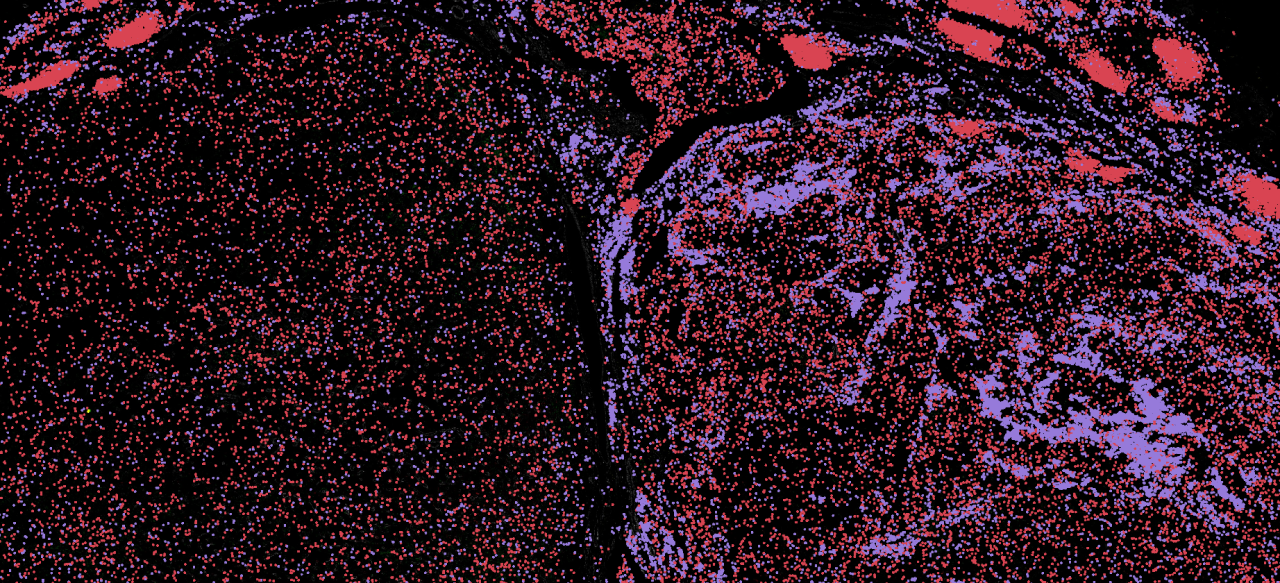
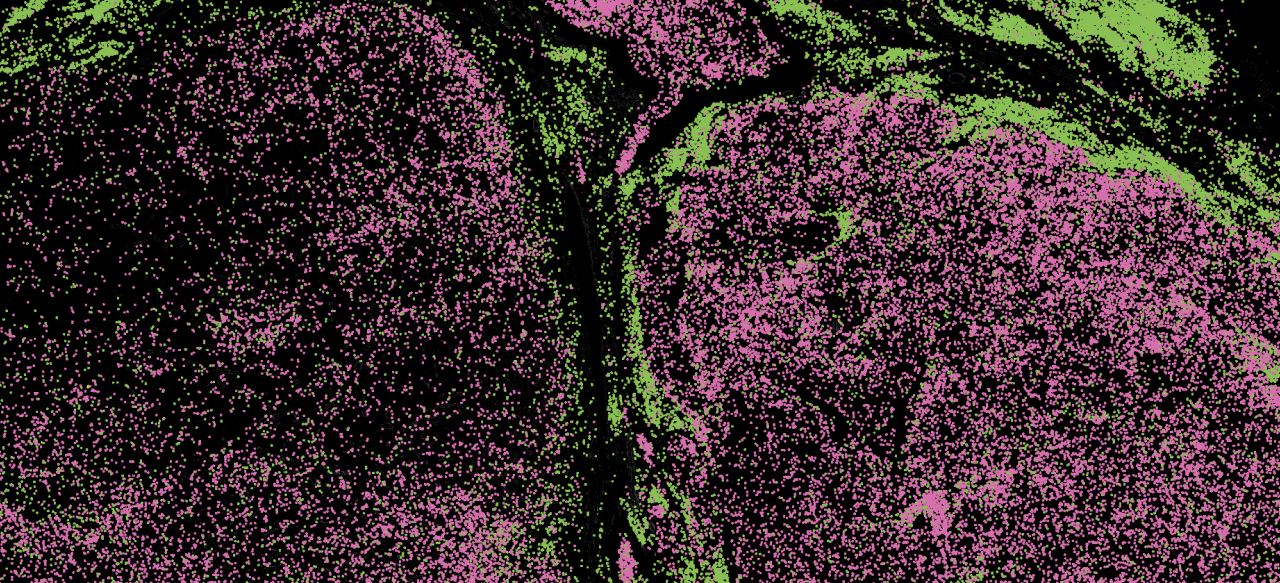
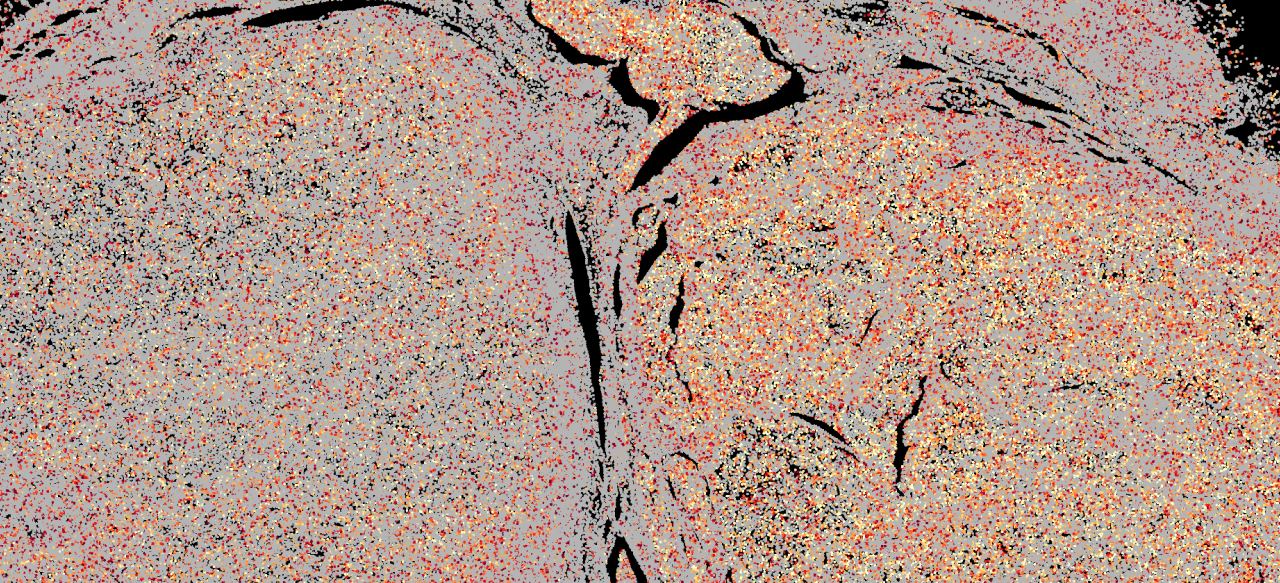
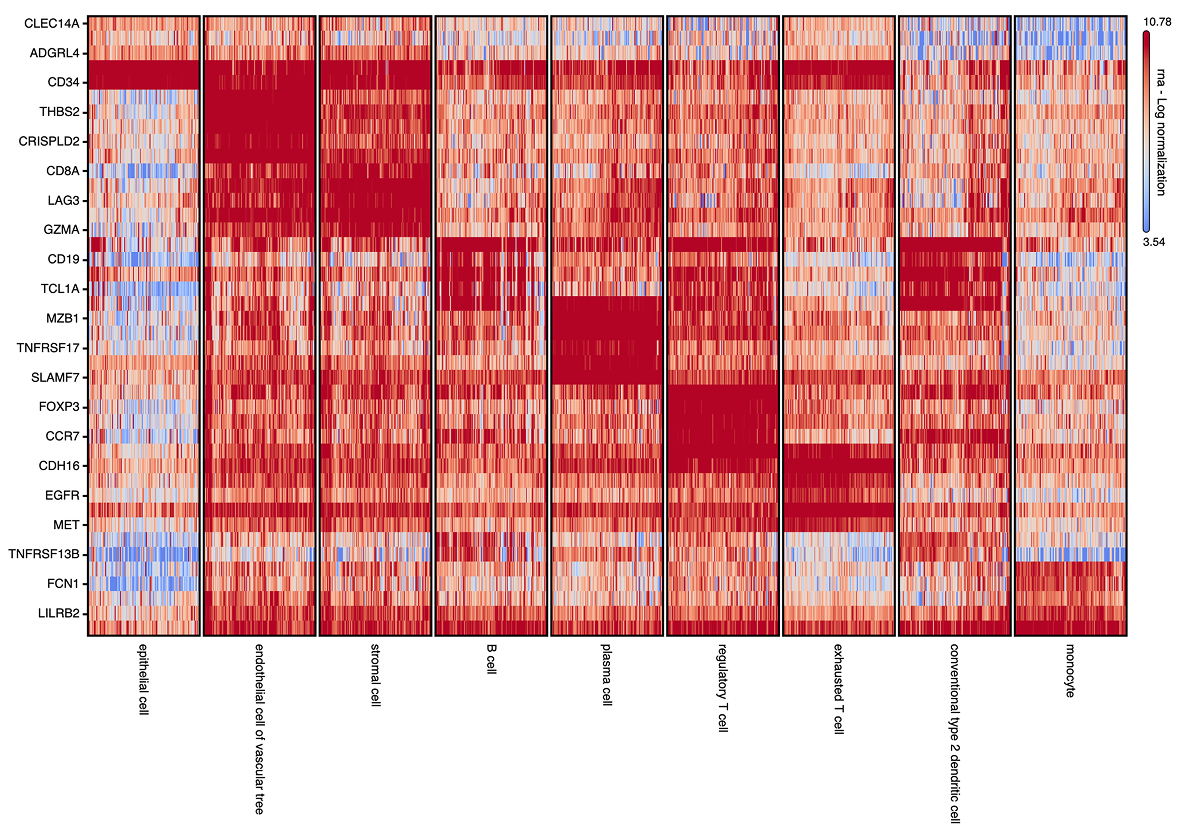
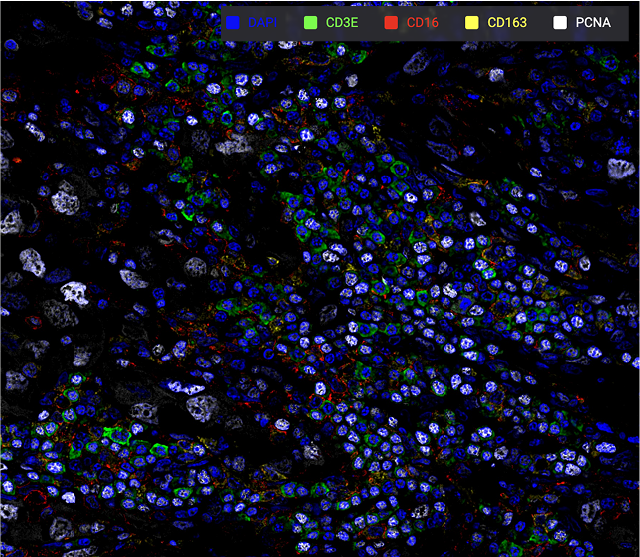
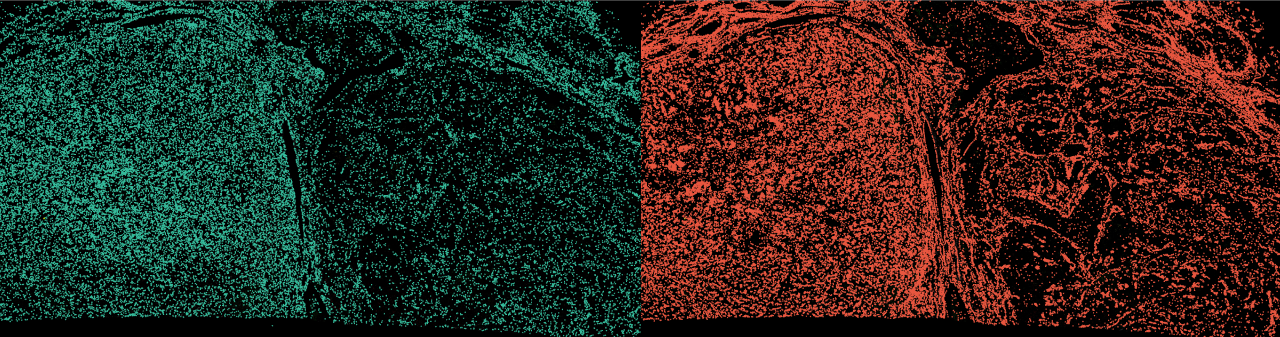
Collecting signal from RNA...
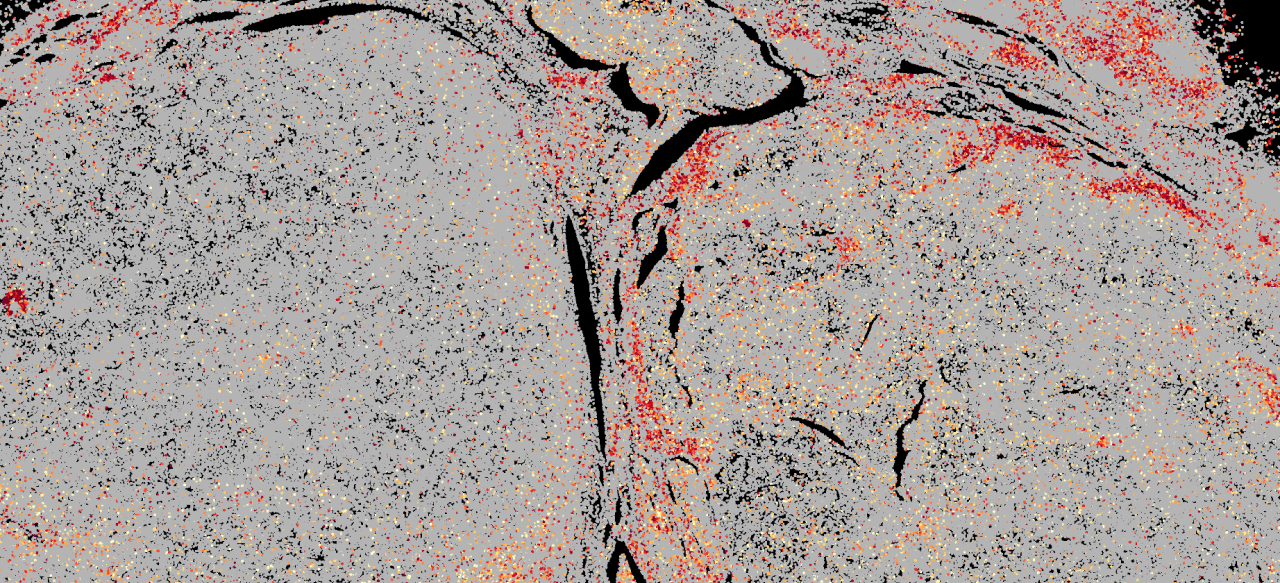
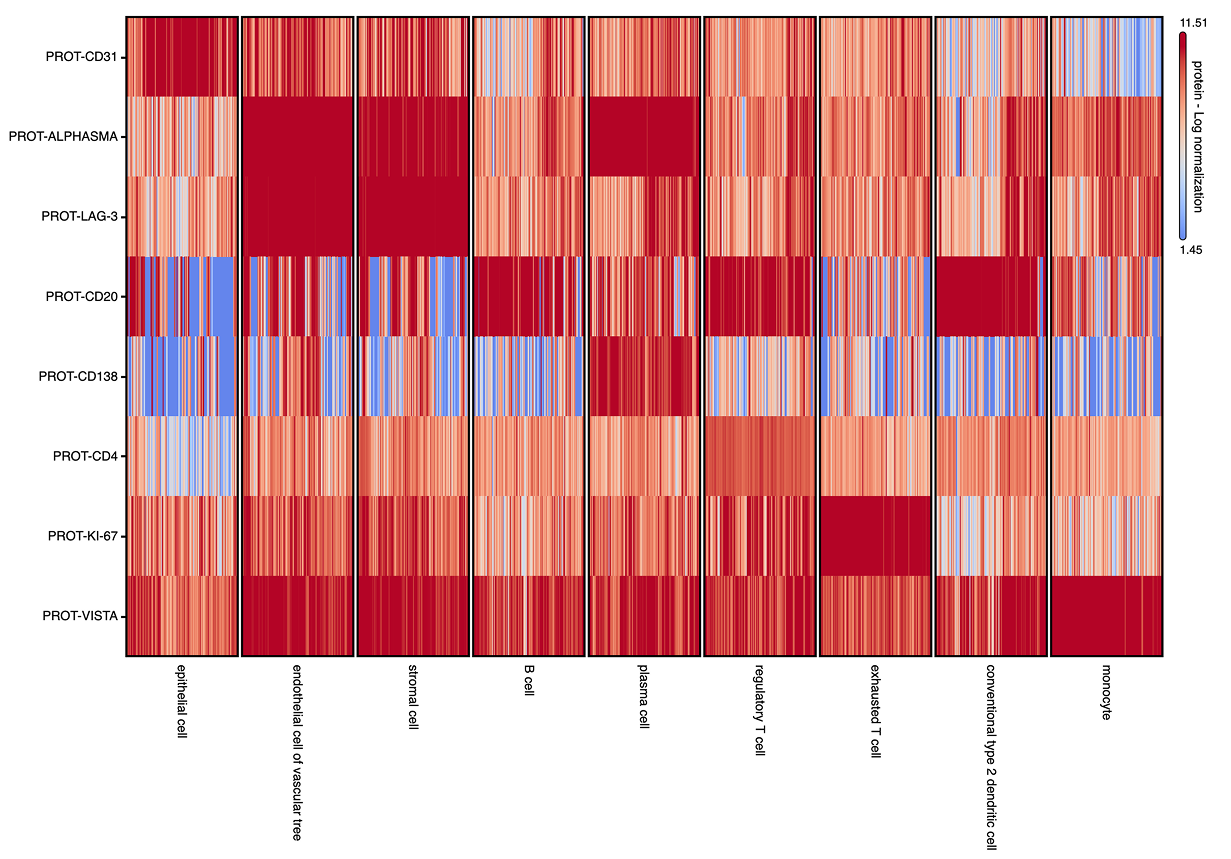
Collecting signal from Protein...
“We are sneaking through the battlefields...”
Our TLS stronghold...
Our forces are on the move
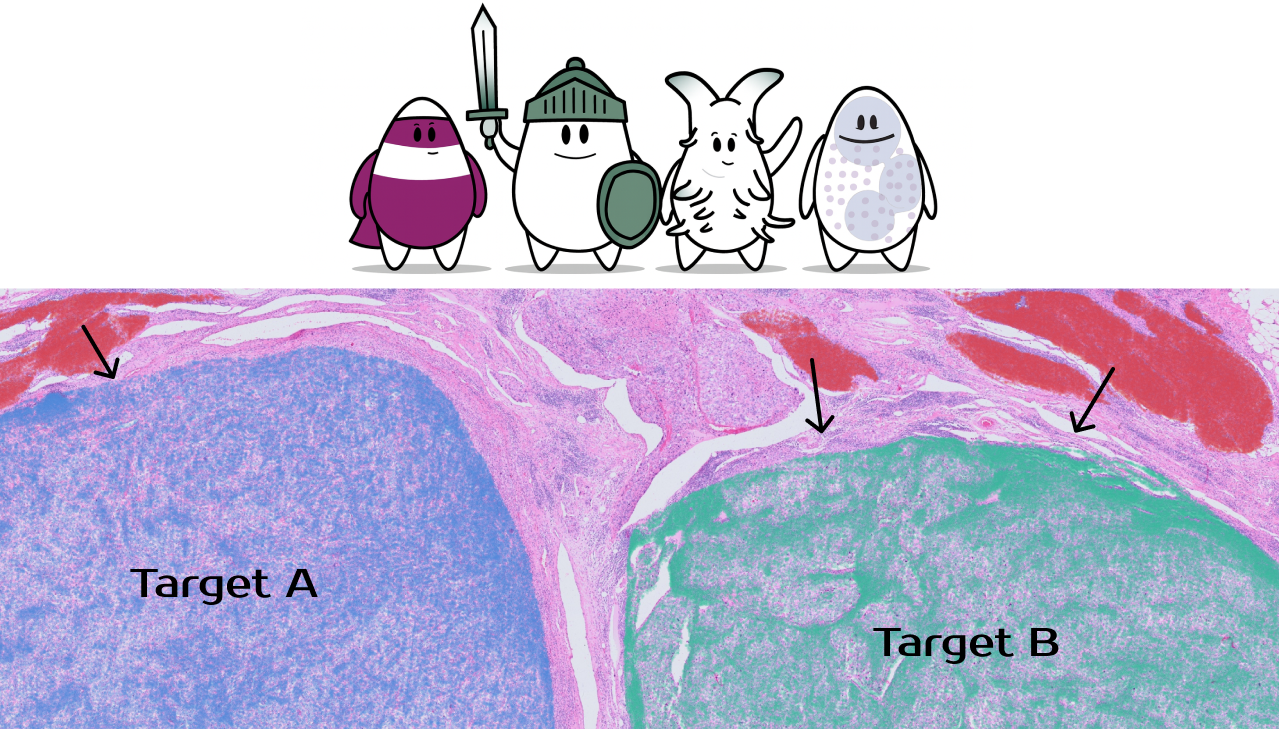
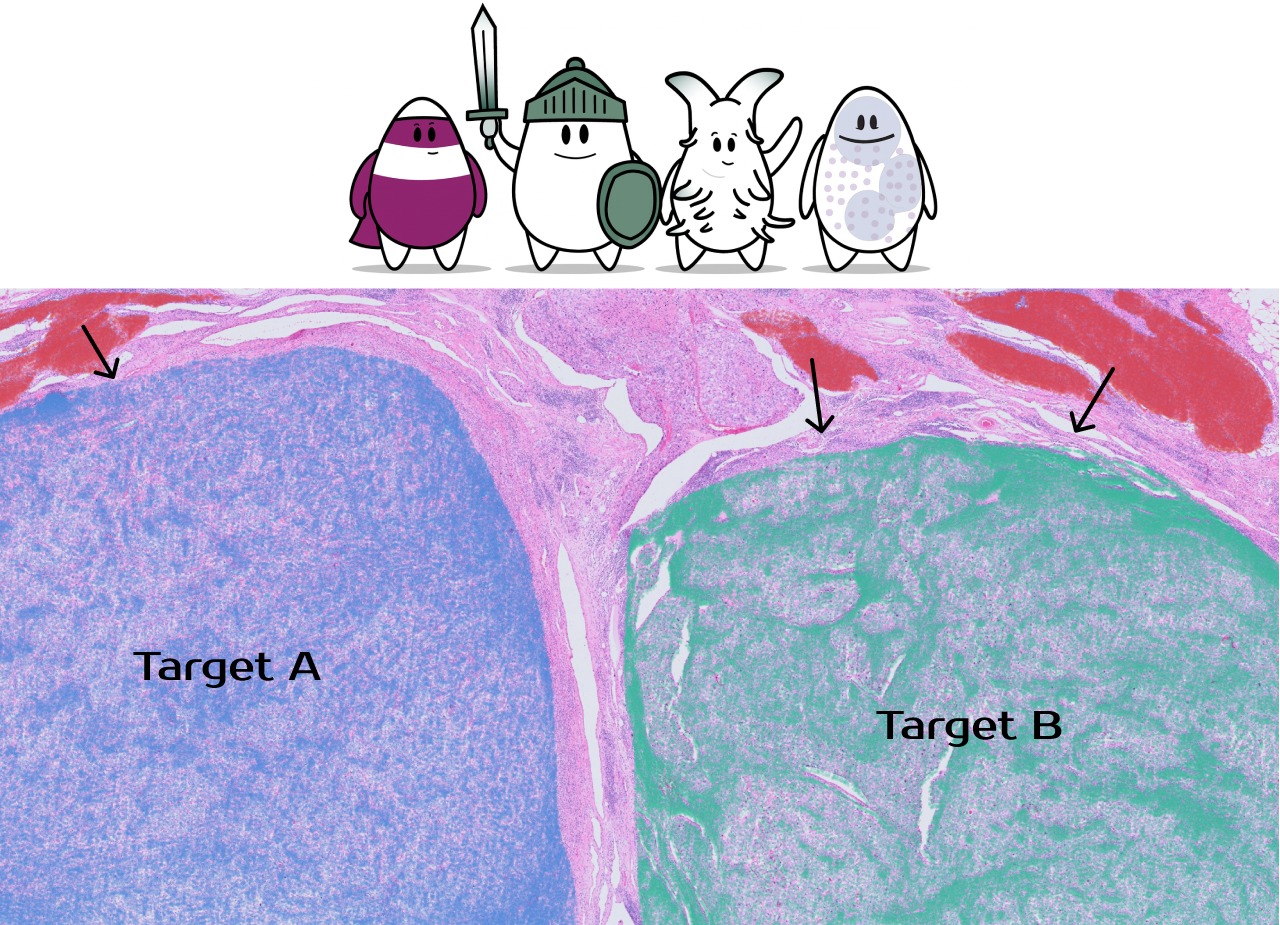
Target A
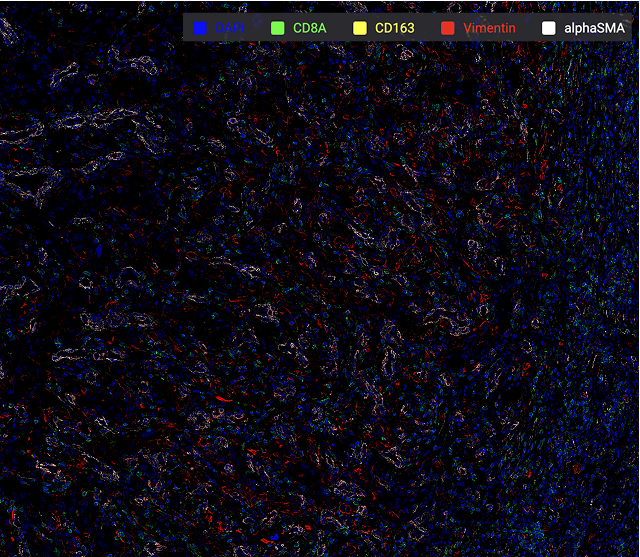
Target B
Analyzing the gathered signals...
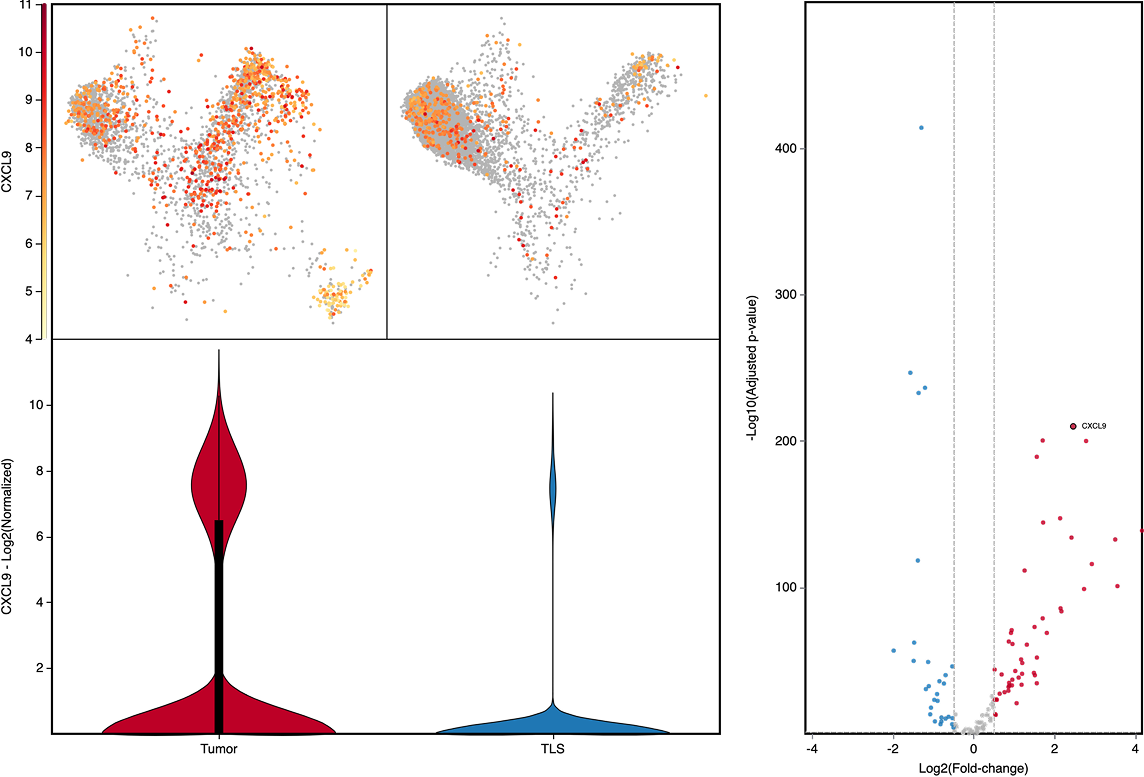
Begins to form assessments...
“We found a hint, sir!
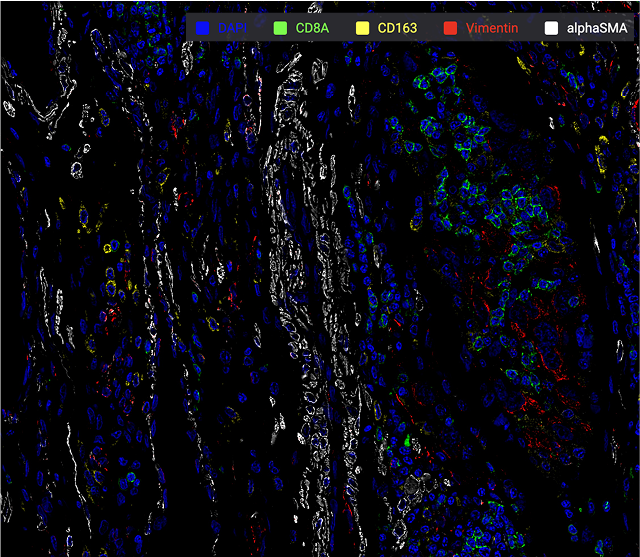
The mysterious alliance of Fibroblasts and Endothelial cells is gathering stronger inside Target A.”
“Look at this ratio... between our forces and theirs.”
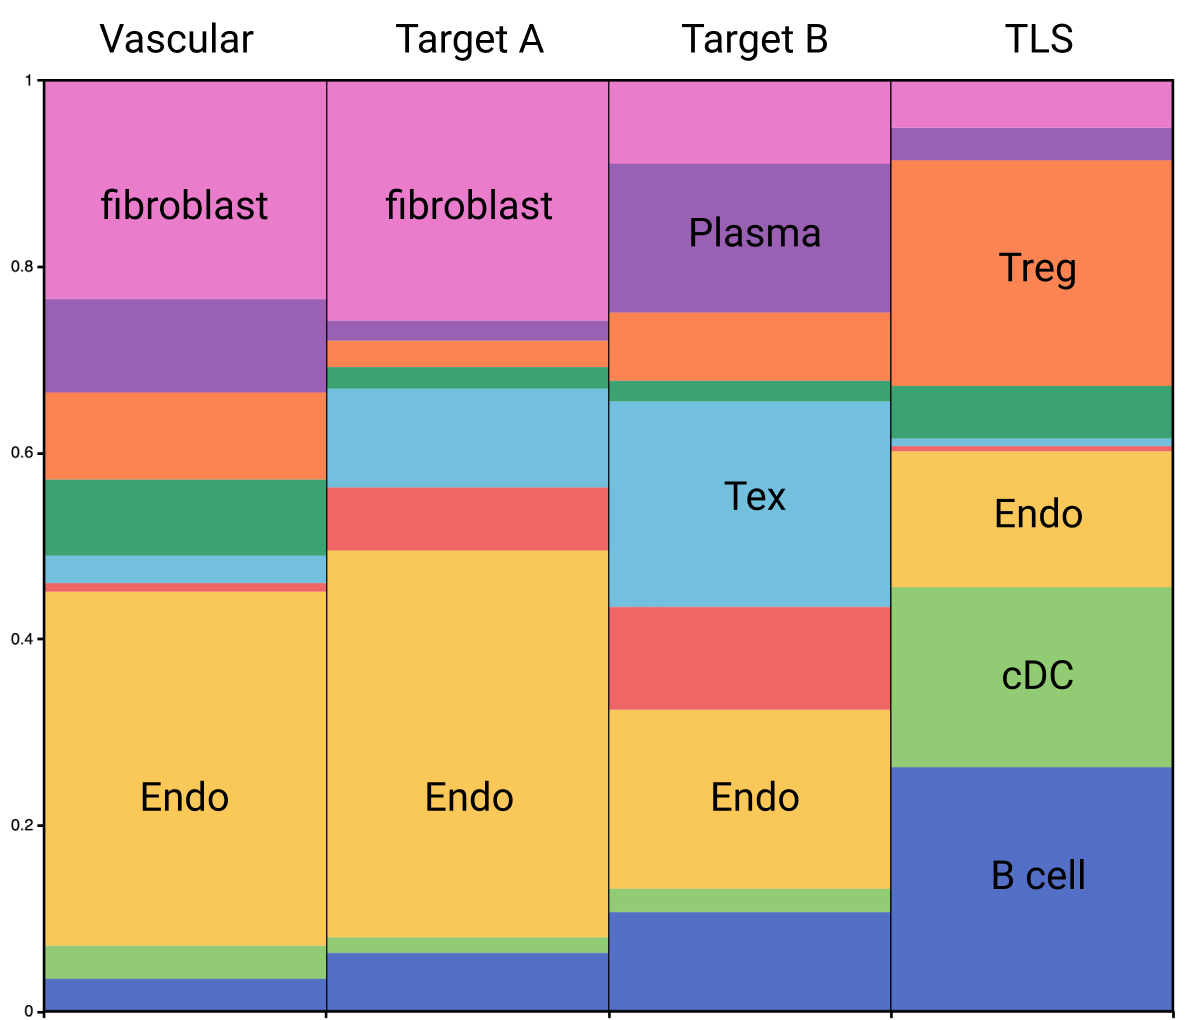
Numbers flickered across the screen, sharp and undeniable. The balance was shifting— and not in their favor.
Will the brave team discover a way to bring down Target A… or will the hidden alliance hold its ground?
....
The story is generated using data from the Xenium In Situ Gene and Protein Expression dataset for FFPE Human Renal Cell Carcinoma (10x Genomics). All analyses and visualizations were performed with the OmnibusX desktop application, including:
- Automatic cell type classification
- Tissue region annotation with H&E images
- Multiplex image channel integration
- Finding marker panels
- Composition analysis
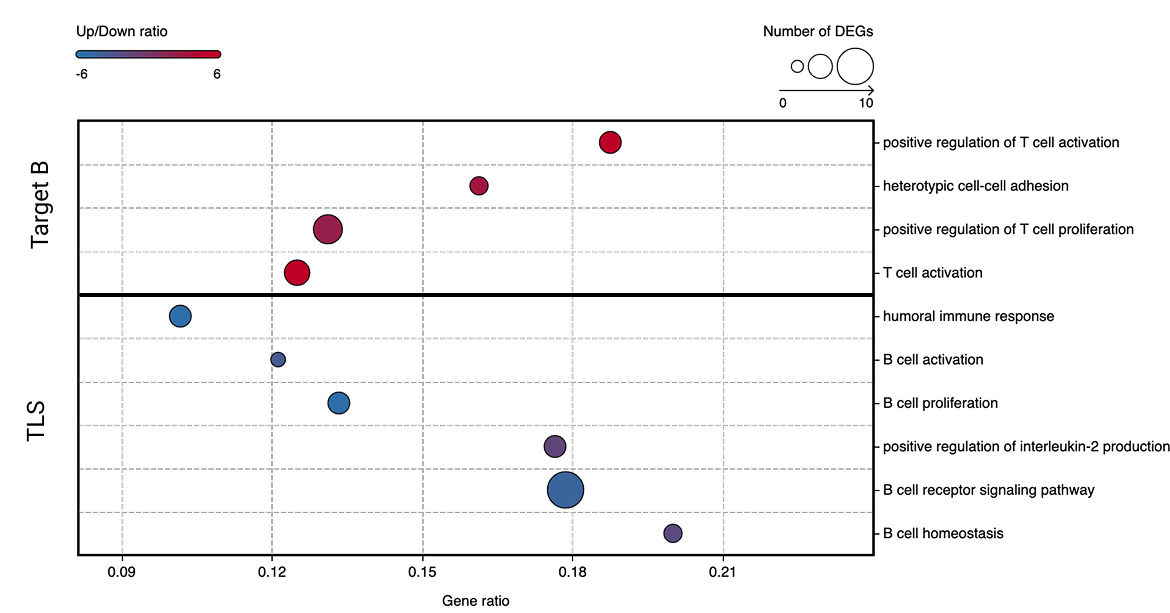
- Differential gene expression analysis
- Enrichment analysis
- Heatmap visualization
- Multi-omics integration of RNA and protein expression
Thank you for reading!